
Revised Download Counts and Package Statistics
In the last few months we have been hard at work on the NuGet.org backend. One of the things we’ve done is switch to a new CDN. This work is all about reinforcing the foundations of nuget.org so we provide a better service experience and be in a position to build new features reliably. As a result we’re happy to announce package statistics are back!
From the NuGet gallery, we can see various statistics and trends in package downloads (for the last 6 weeks).
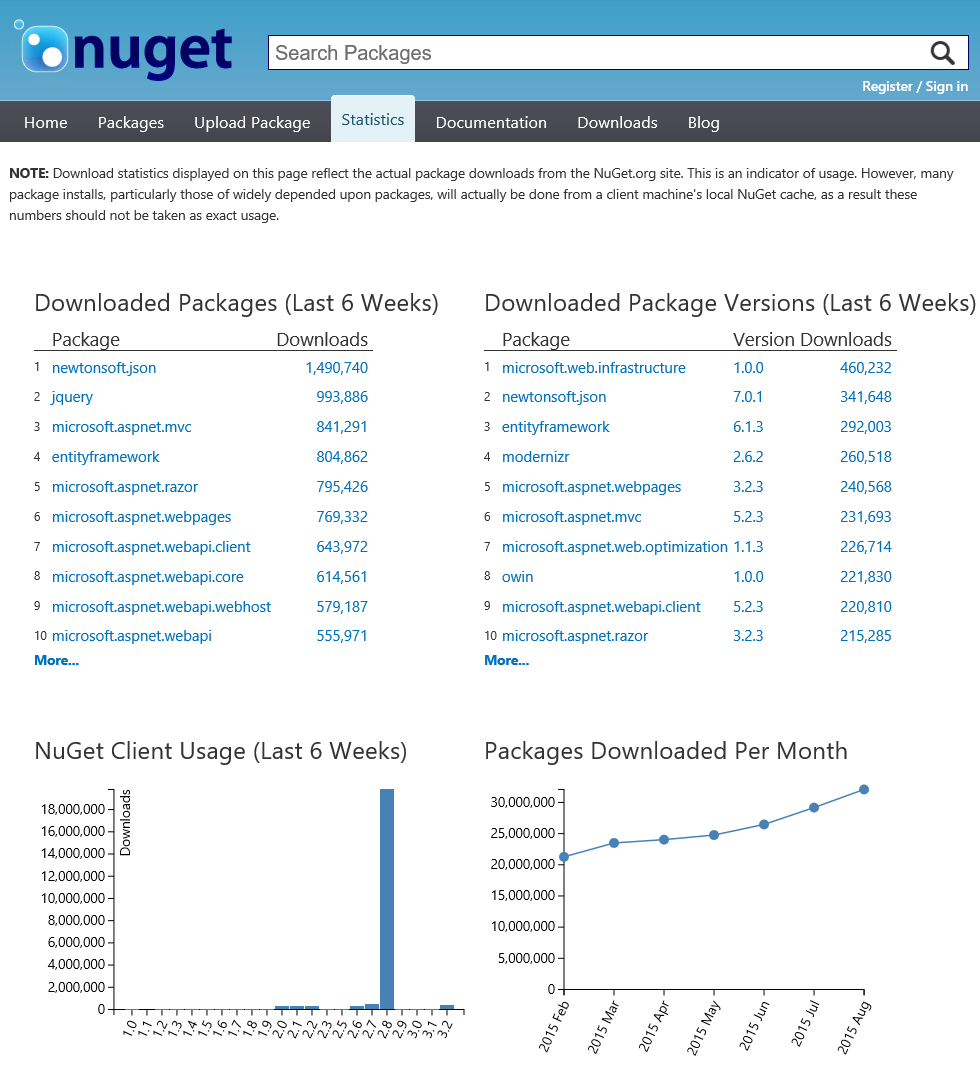
We can drill down to individual packages and get details on the number of downloads per package version, NuGet client name and even the operation. This allows us to compare the volume of new package installs to package restores.
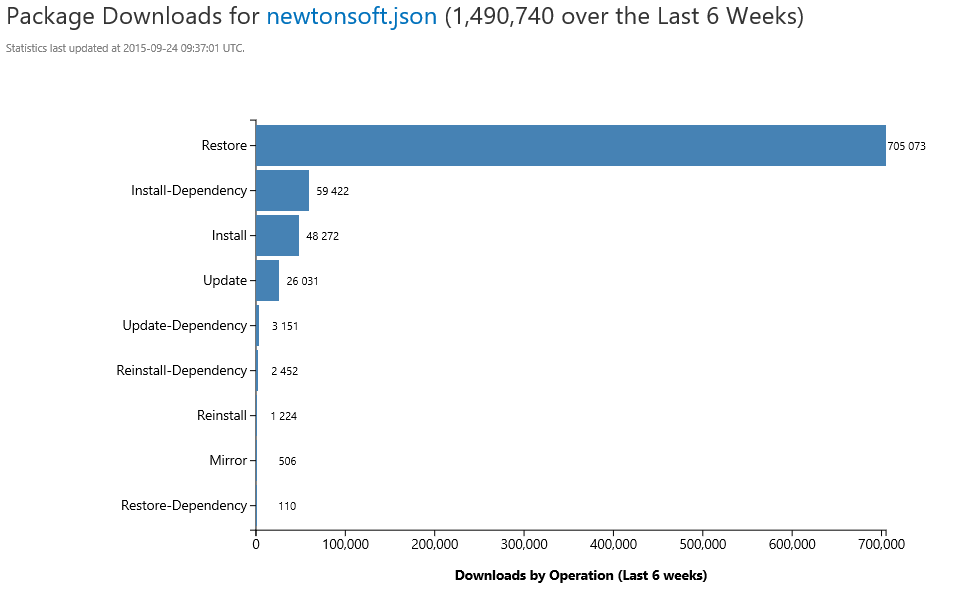
Package statistics allow package authors to get an idea of how many times their package was downloaded. As a package consumer, we can look at the download counts to see if a particular package is being used by just a few developers, or the world.
Background
With more and more developers starting to use NuGet in their workflow, we saw an increase in downloads, load and stress on our servers.
Back in April we identified that a key place the stress was coming from was package statistics. Every package download would write a log entry into the database, then redirect to our CDN. Writing this log entry would, depending on the amount of users hitting the NuGet feed, often block or timeout, resulting in unhappy developers worldwide. As a quick fix, we made a calculated compromise that affected package owners by disabling this logging.
We quickly re-enabled package download tracking, but disabled the statistics reports. This means we still collected data on the “side”, confident of not losing historical information, but keeping the server healthy for the package consumers audience.
How we track package downloads
Fast-forward a few months, and we redesigned the way we collect package download information. Our main goal was to reduce churn on the gallery database. As a matter of fact, we decided to remove downloads information from the main database altogether.
A first step towards getting package statistics back was switching CDN providers. With the Azure CDN, we are able to collect raw request logs from the various CDN nodes around the world. There is a small delay in getting these request logs, but since we can trust the CDN to keep track of download information such as the package URL and NuGet client version, we no longer have to log this information ourselves.
A second step, of course, was parsing these logs. There are a number of good and fast libraries out there that can parse the W3C log file format we get from the CDN. Parsing is one thing, but cleaning up data a second thing. We spent a lot of time parsing gigabytes of logs each day, analyzing the incoming data. We’ve seen weird requests that we didn’t want to keep track of – some developers seem to have configured NuGet as a Maven source. We’ve seen crazy values in user agent strings and request URLs in general.
Once we were confident we could filter out the required information from these logs, we started working on a new data warehouse where each download is linked to various dimensions like date and time, client version, package id and so on. From this warehouse, we can now generate download counts displayed on the NuGet gallery and in Visual Studio, the various statistics shown on the website and so on.
Of course, that’s not all. We wanted to keep the “old” data, which we had to import into our new data warehouse. After trying several approaches (querying and matching), we found that the cleanest way would be to import the old data as a W3C log file itself. We exported the old warehouse into a few gigabytes of logs, and let our newly created ingestion jobs crunch them into facts.
In the meanwhile, we looked at what would be the best way to get these numbers into the NuGet website. For statistics this was an easy task: we could generate the same files the gallery has always served statistics from. More complex was the use of the DownloadCount from our gallery database all over the place. We built a thin interception layer that sets the download counts from the same source our V3 search engine uses. We also had some raw SQL queries to replace for the autocomplete feature in the VS2013 Package Manager Console – which we now forward to the V3 API.
Why are some numbers different from before? How reliable are these statistics?
While analyzing the data we have in our statistics warehouse, we found that there is a large number of user agents that should not be represented in download counts and statistics. One example of clients types which we now exclude are search engine crawlers. This change makes the numbers now represent actual package consumption.
All of these changes now provide reliable statistics, and can be used to build out new features going forward. By leveraging the CDN request logs, we can now also track downloads that are made by DNX, as it never used the gallery endpoints anyway. Load on our main gallery database dropped significantly, resulting in a faster and more stable NuGet.org experience.
Thanks folks for being so patient with us on this.
 Light
Light Dark
Dark
0 comments